Mobile App Node Monitoring
General
This is a free monitoring tool provided by beaconcha.in to enhance the solo staking experience. The user specifies the monitoring endpoint on its consensus layer and validator node..png?fit=max&auto=format&n=bISFwNjB_9Ym1Ov6&q=85&s=a13a291d3ffd4b8b23444f4046befe25)
Requirements
- beaconcha.in Account
- beaconcha.in Mobile App
- Lighthouse v.1.4.0 or higher
- Prysm v1.3.10 or higher
- Nimbus v1.4.1 or higher
- Teku v22.3.0 or higher
- Lodestar v1.6.0 or higher
- Staking on Linux (No windows support by clients yet!)
Please adjust the network on the beaconcha.in browser and mobile app accordingly.
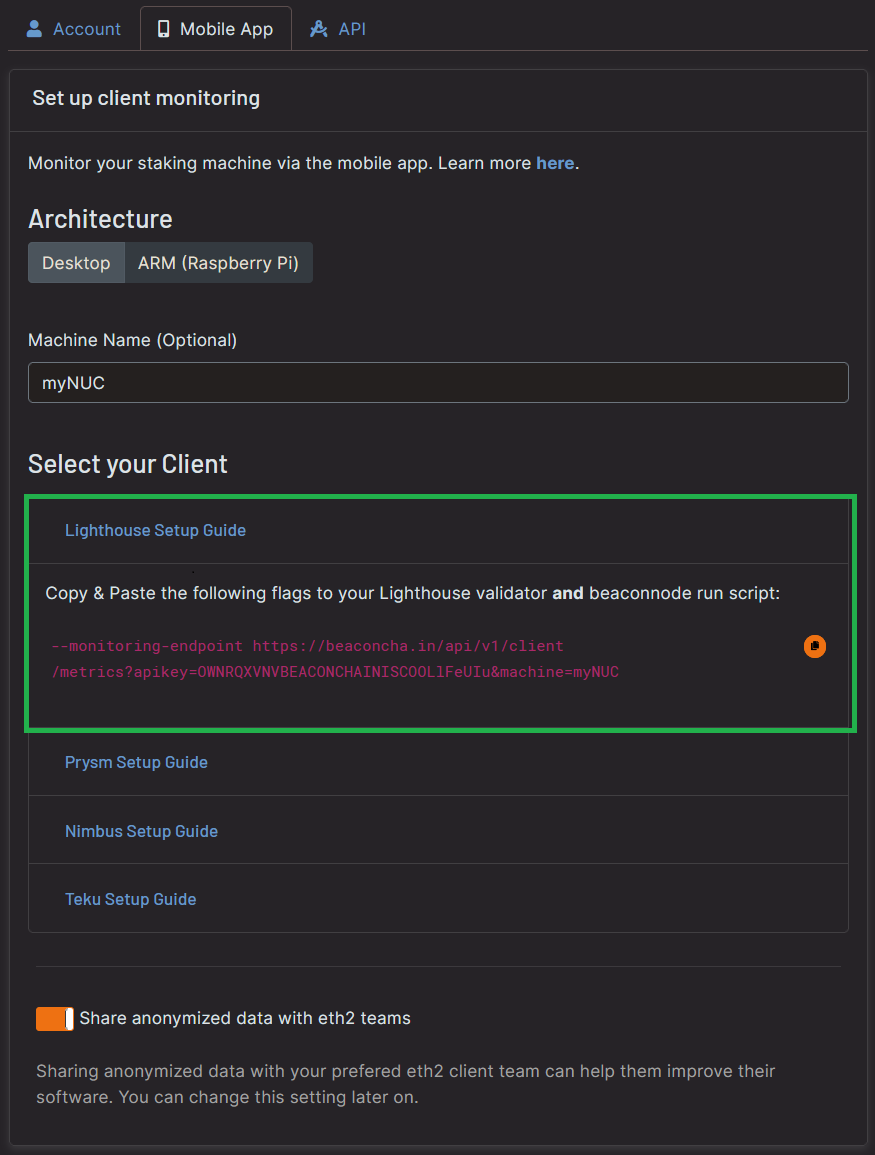
Lighthouse
A step-by-step guide on the Prater Testnet. Please adjust the network for your own needs.- Open the Mobile App Tab and enter a name for your staking setup.
Use the same worker name even if your consensus layer node runs on a separate machine than your validator node.
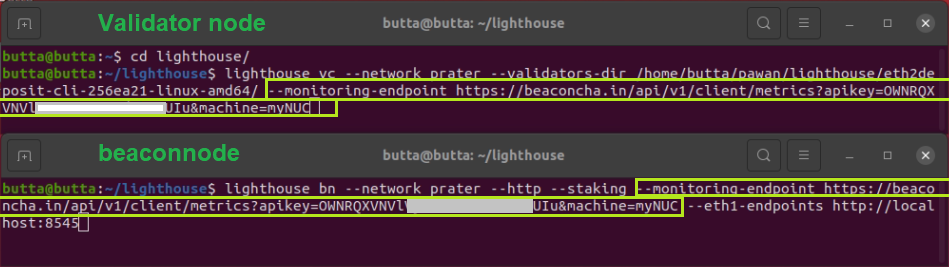
Copy the generated flag and paste it to your beacon & validator node
2. Open the beaconcha.in mobile app and login with your account under Preferences.
Your staking device will appear under Machines!
.png?fit=max&auto=format&n=bISFwNjB_9Ym1Ov6&q=85&s=1d008b8a94e486eb3da6b7e7c41bce12)
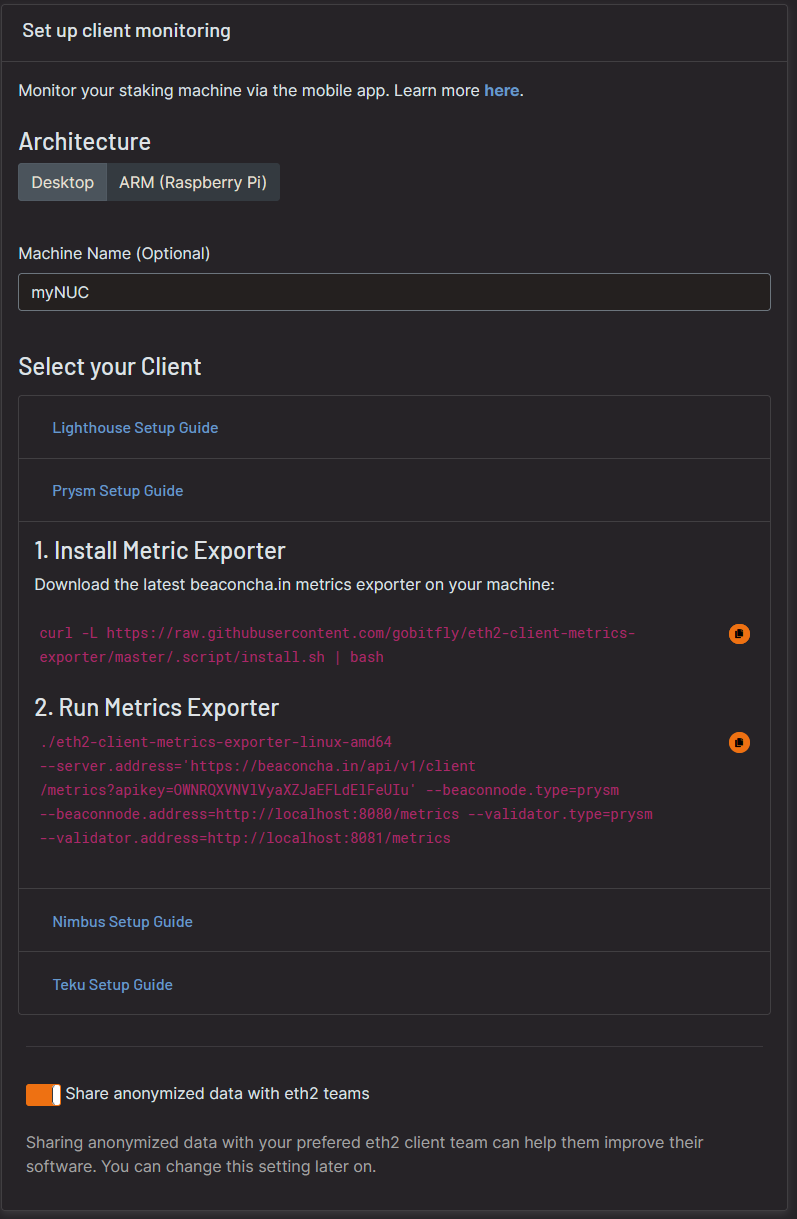
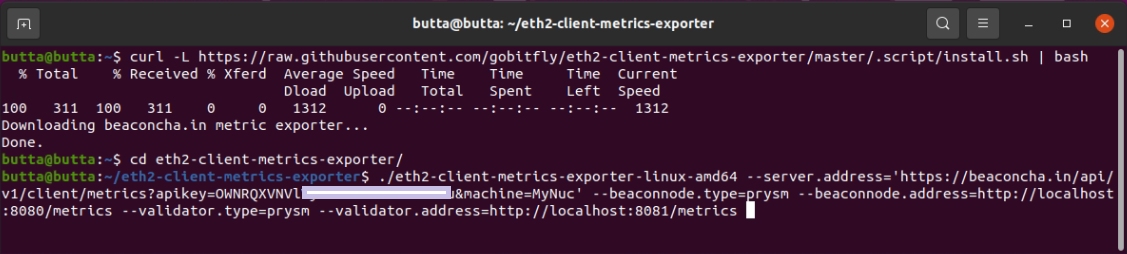
Prysm
- Head over to the beaconcha.in settings and open the prysm section:
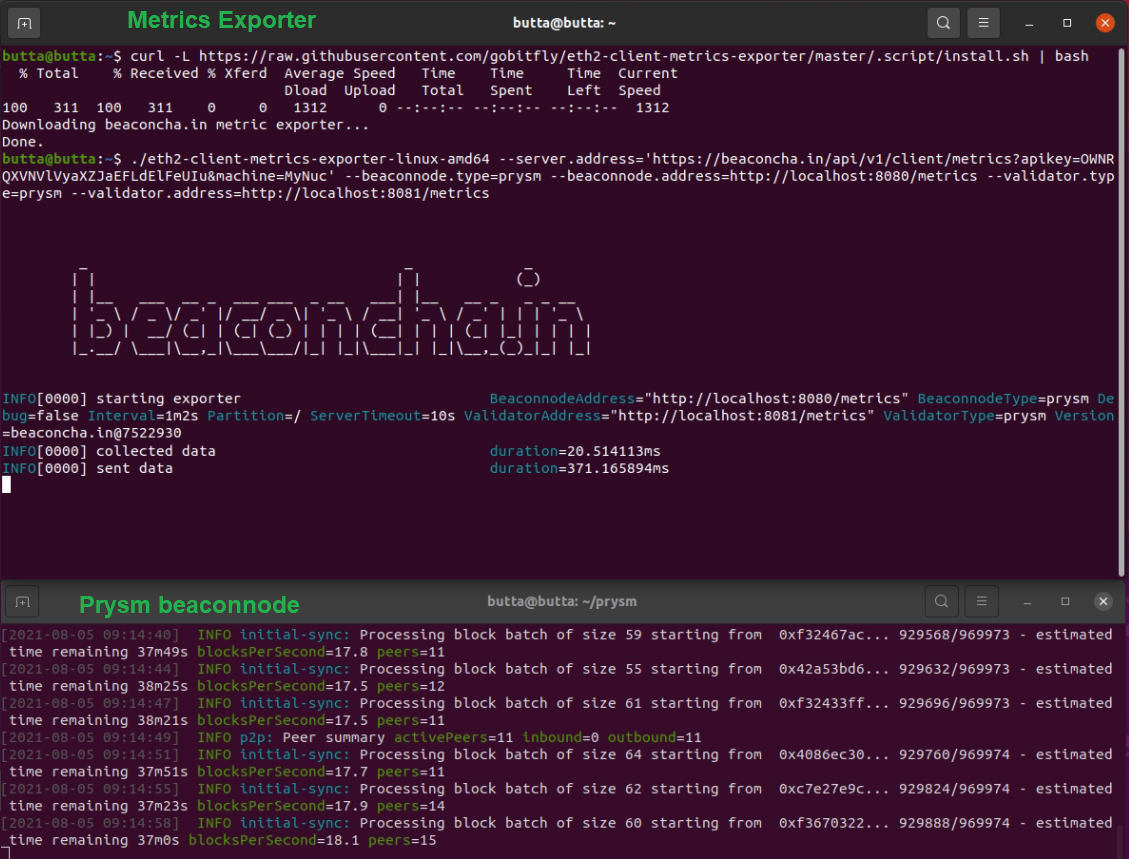
Your staking device will appear under Machines!
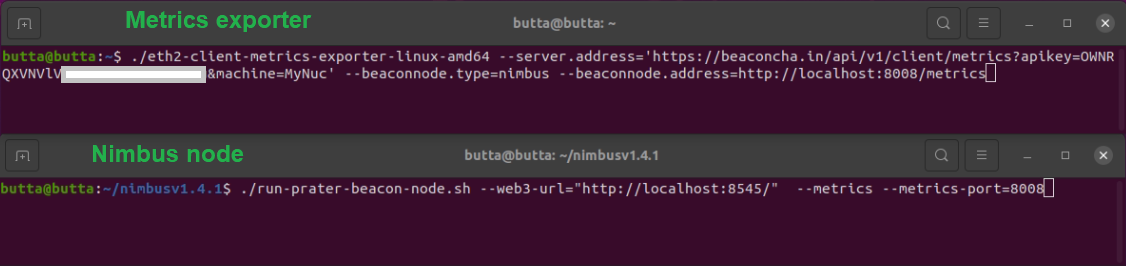
Nimbus
- Head over to the beaconcha.in settings and open the nimbus section:
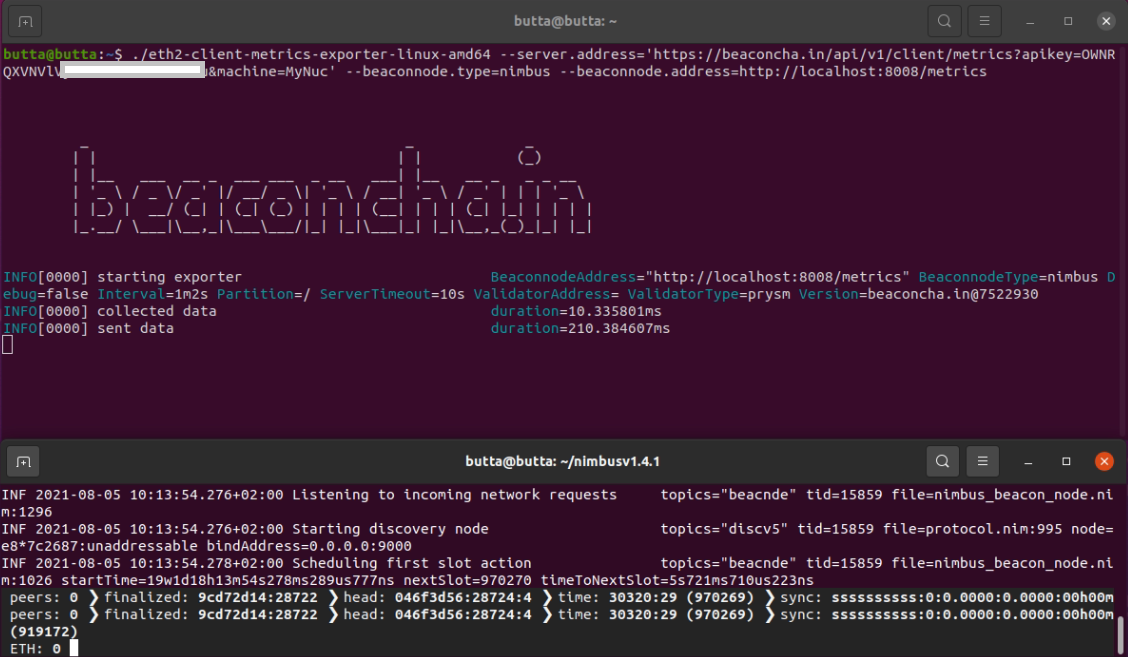
--metrics --metrics-port=8008 to your nimbus client! Otherwise, the exporter will not be able to get any data from your client.
Your staking device will appear under Machines!
Teku
Add the following endpoint to your teku node--metrics-publish-endpoint https://beaconcha.in/api/v1/client/metrics?apikey=YOUR_API_KEY
You can find your API Key here: https://beaconcha.in/user/settings#app
Lodestar
Add the following CLI flag to your Lodestar validator and consensus layer node--monitoring.endpoint 'https://beaconcha.in/api/v1/client/metrics?apikey=YOUR_API_KEY'
You can find your API Key in the account settings.
Check out the Lodestar documentation about client monitoring for further details.
Monitoring with Rocket Pool
Works with Lighthouse, Lodestar, Teku and Nimbus only.Lighthouse, Lodestar and Teku
Add Your beaconcha.in API key in Monitoring/Metrics (service config)%20(1)%20(1)%20(1).png?fit=max&auto=format&n=bISFwNjB_9Ym1Ov6&q=85&s=bc70564c59e7585277da641df3a3a892)